

As with most things in 2024, artificial intelligence has played a dominant role in Looker Studio’s evolution. From conversational analytics to AI assistance in calculated fields, these innovations are reshaping how we analyse, interact with and interpret data. By including AI into its core features, the team at Looker Studio are trying to make it easier than ever for users to uncover actionable insights as quickly and effectively as possible. Below is a breakdown of some of the new gemini features available in Looker Studio:
Gemini Powered Conversational Analytics
From our point of view, the headline feature of 2024 is the introduction of Gemini’s Conversational Analytics. Not so much for its initial capabilities but more for the exciting potential it holds for the future. This feature leverages artificial intelligence to enable natural language querying, transforming the way users interact with data. Simply type a question, such as “What were the sales trends last quarter?”, and receive insightful answers without needing technical expertise. By lowering the barriers to data exploration, Gemini makes analytics accessible to everyone, regardless of skill level.

Calculated Fields with Gemini Assistance
Gemini in Looker now lets you create calculated fields with the assistance of AI. By describing the type of field you’d like to create, Gemini suggests formulas using data source fields and Looker Studio functions, making calculated field creation faster and more intuitive for all users.
Google Slides Generation with Gemini Assistance
Gemini also enables users to export Looker Studio report visualisations to Google Slides. This feature lets you add report charts as images, generate textual summaries for each visualisation, and insert them directly into your presentation. Whether creating new presentations or updating existing ones, this integration streamlines the process of sharing insights with teams and stakeholders.
Other Valuable Features
Looker Studio has introduced a range of additional features this year that enhance both usability and functionality, making it easier than ever for users to build insightful dashboards and reports.
New Funnel Chart Option
The new funnel chart option was a much needed addition for visualising sequential processes. Before its introduction, many users relied on community visualisations to fill the gap, which can sometimes lack the seamless integration and polish of a native chart.
The funnel chart is ideal for tracking user journeys, conversion rates, or sales pipelines, providing a clear and intuitive view of how metrics evolve across stages. Certainly a valuable addition to any dashboard!

Customisable Chart Titles
Users can now add and fully customise chart titles in Looker Studio. This feature allows adjustments to fonts, colours, sizes, styles, and positions, giving users full control over presentation. Previously, titles could only be added through separate text boxes, making this a much-needed improvement for streamlined design.
Preview Your Data
The new data preview functionality in the data source editor provides instant insights into your dataset. This helps users quickly validate their data connections and minimise errors during setup, streamlining the dashboard creation process.
Dimensions in Scorecards
Scorecards now support dimensions, adding flexibility for users to present various data types with greater context. This feature is particularly useful for displaying dates and strings in a clear and concise manner. For instance, if you want to highlight the date of the most recent available data, this functionality provides an ideal solution.
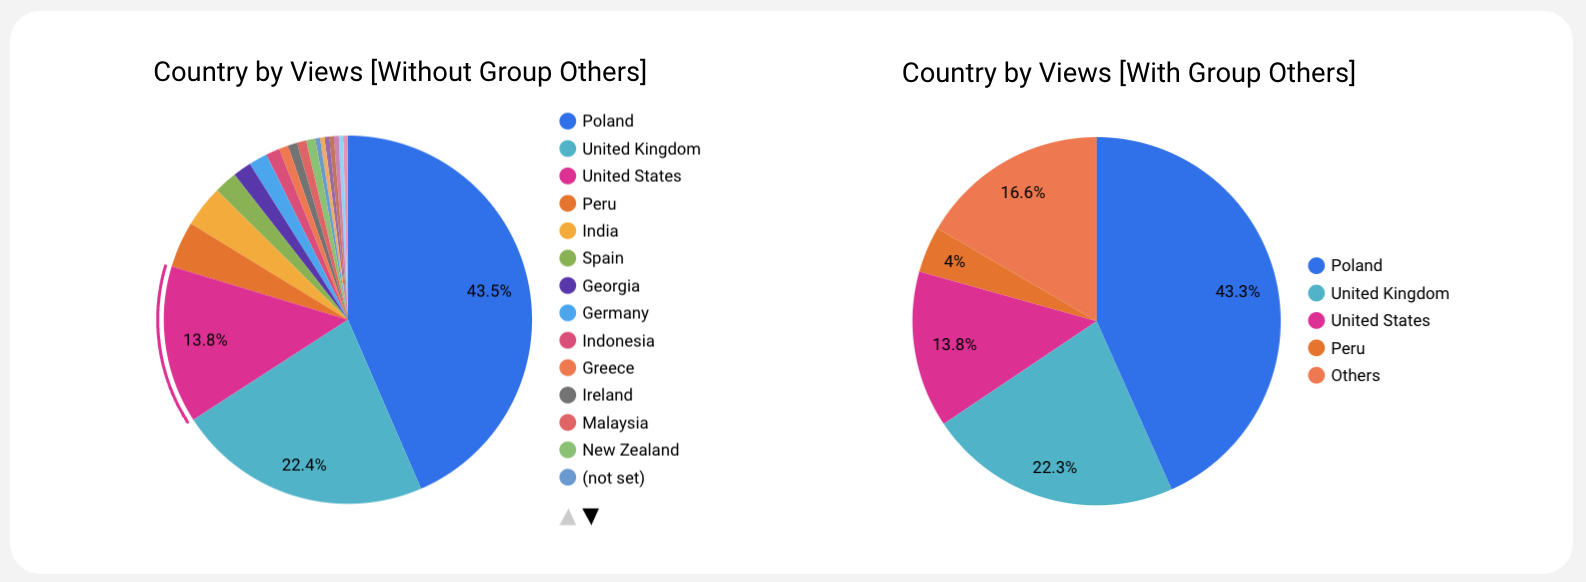
Group Lesser Categories
The ‘Group Others’ feature simplifies complex visualisations by consolidating less significant categories into an “Other” group. This ensures cleaner and more concise presentations, particularly for reports with numerous data points. For example, in a pie chart with 20 categories where the bottom 15 account for just 5 percent of the total, grouping them as “Other” creates a more polished and easy-to-interpret visualisation.
Organised Team Workspaces
For Pro users, folders and subfolders now make it easier to organise assets such as reports and data sources. This structured approach to workspace management improves collaboration and efficiency, especially for larger teams handling multiple projects.
Improved Integrations
Microsoft Excel Connector: Looker Studio’s Excel connector allows users to connect worksheets directly to dashboards, removing the need for manual data uploads.
Google Sheets Report Creation: Reports can now be created directly within Google Sheets, streamlining workflows for teams relying on spreadsheets for collaboration and analysis.
Conclusion
Looker Studio’s updates in 2024 highlight its continued evolution into a powerful, user-friendly tool for data visualisation. With features that simplify workflows, enhance customisation, and harness the potential of AI, the platform is making analytics more accessible than ever. Whether you’re a seasoned analyst or just starting your data journey, these updates provide the tools you need to gain deeper insights and make smarter decisions.
By bridging the gap between technical and non-technical users, Looker Studio empowers collaboration across teams and reinforces its position as an essential resource in modern data strategies.


